
Original post by Lauren McNeely from Lucidchart
PlanSwift Software, the world’s fastest growing developer and distributor of digital estimating and takeoff software for the construction industry, could be the poster child for visual thinking. As you walk into their office, you’re met with walls of whiteboards. That’s because Marketing Manager Aaron Stitt likes to visualize just about everything.
But people learn and think differently. “Aaron’s whiteboards are great and everything—they’re awesome, and he knows exactly what he’s talking about. But when you go back to look at the whiteboard, it’s almost impossible to decipher what he was talking about,” says Jace Brown, marketing specialist.
To keep everyone on the same page, you’ll find the PlanSwift marketing team using Lucidchart on the daily. As a visual learner, Aaron is just as big a fan of Lucidchart as he is of whiteboards. Aaron takes his whiteboard creations and translates them using Lucidchart—that way everyone can understand his big ideas. And that makes his team pretty big fans of the tool themselves.

“Anytime Aaron wants to show what his idea looks like, he’ll mock it up in Lucidchart, even if it’s just a graphic we’re putting on the website or a social media post. Literally anything he wants to represent,” describes Jace.
Lucidchart is Aaron’s one-stop solution for visually representing concepts that he and his team can easily reference. The tool is one of the first that new hires are introduced to, as it plays a big role on the marketing team, from planning and ideation to approval and execution.
Sprint planning
The marketing team approaches their sprint planning armed with both Lucidchart and JIRA. Using swimlane diagrams, the team outlines what their release schedule will look like for social media, blogs, and other content. The diagram allows them to indicate how much work a certain item will require.
Beyond this overview, the team has also found it useful to create timelines for specific project in order to ensure timely execution. PlanSwift loves that Lucidchart is in the cloud so that people can be working on the same document at once. During these sprint-planning meetings, the whole team can collaborate in real time.
Optimizing the customer lifecycle
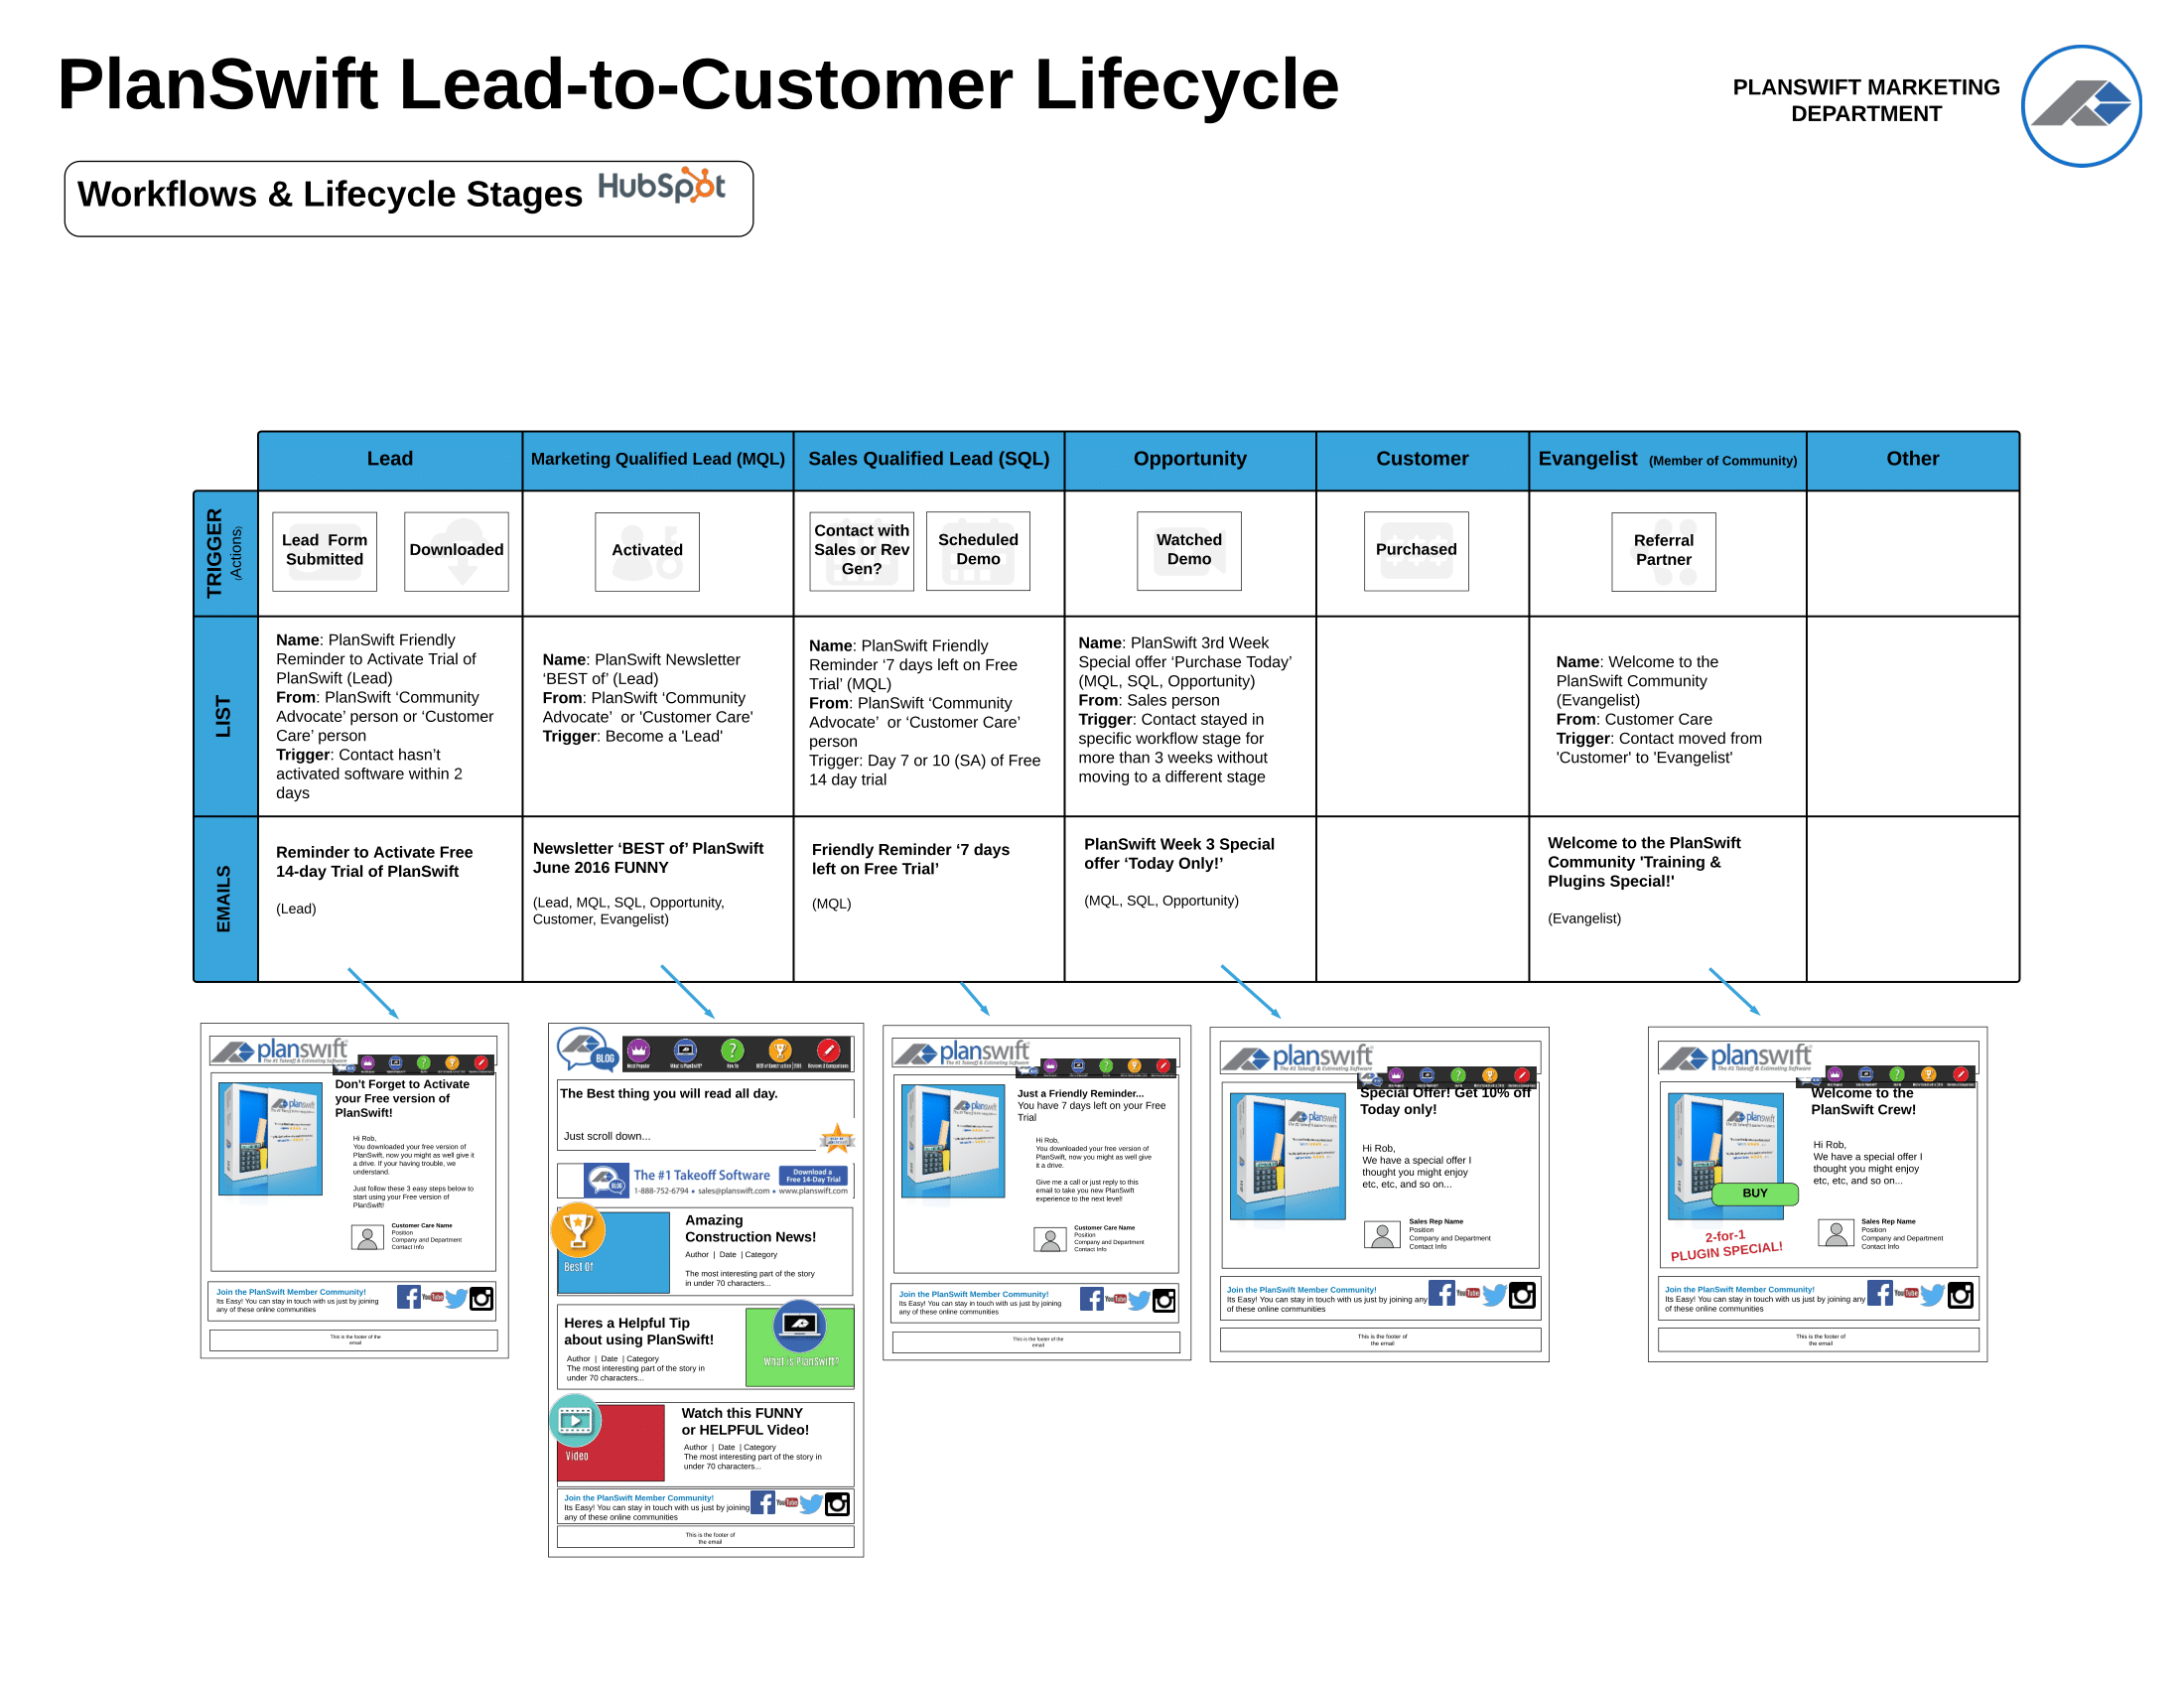
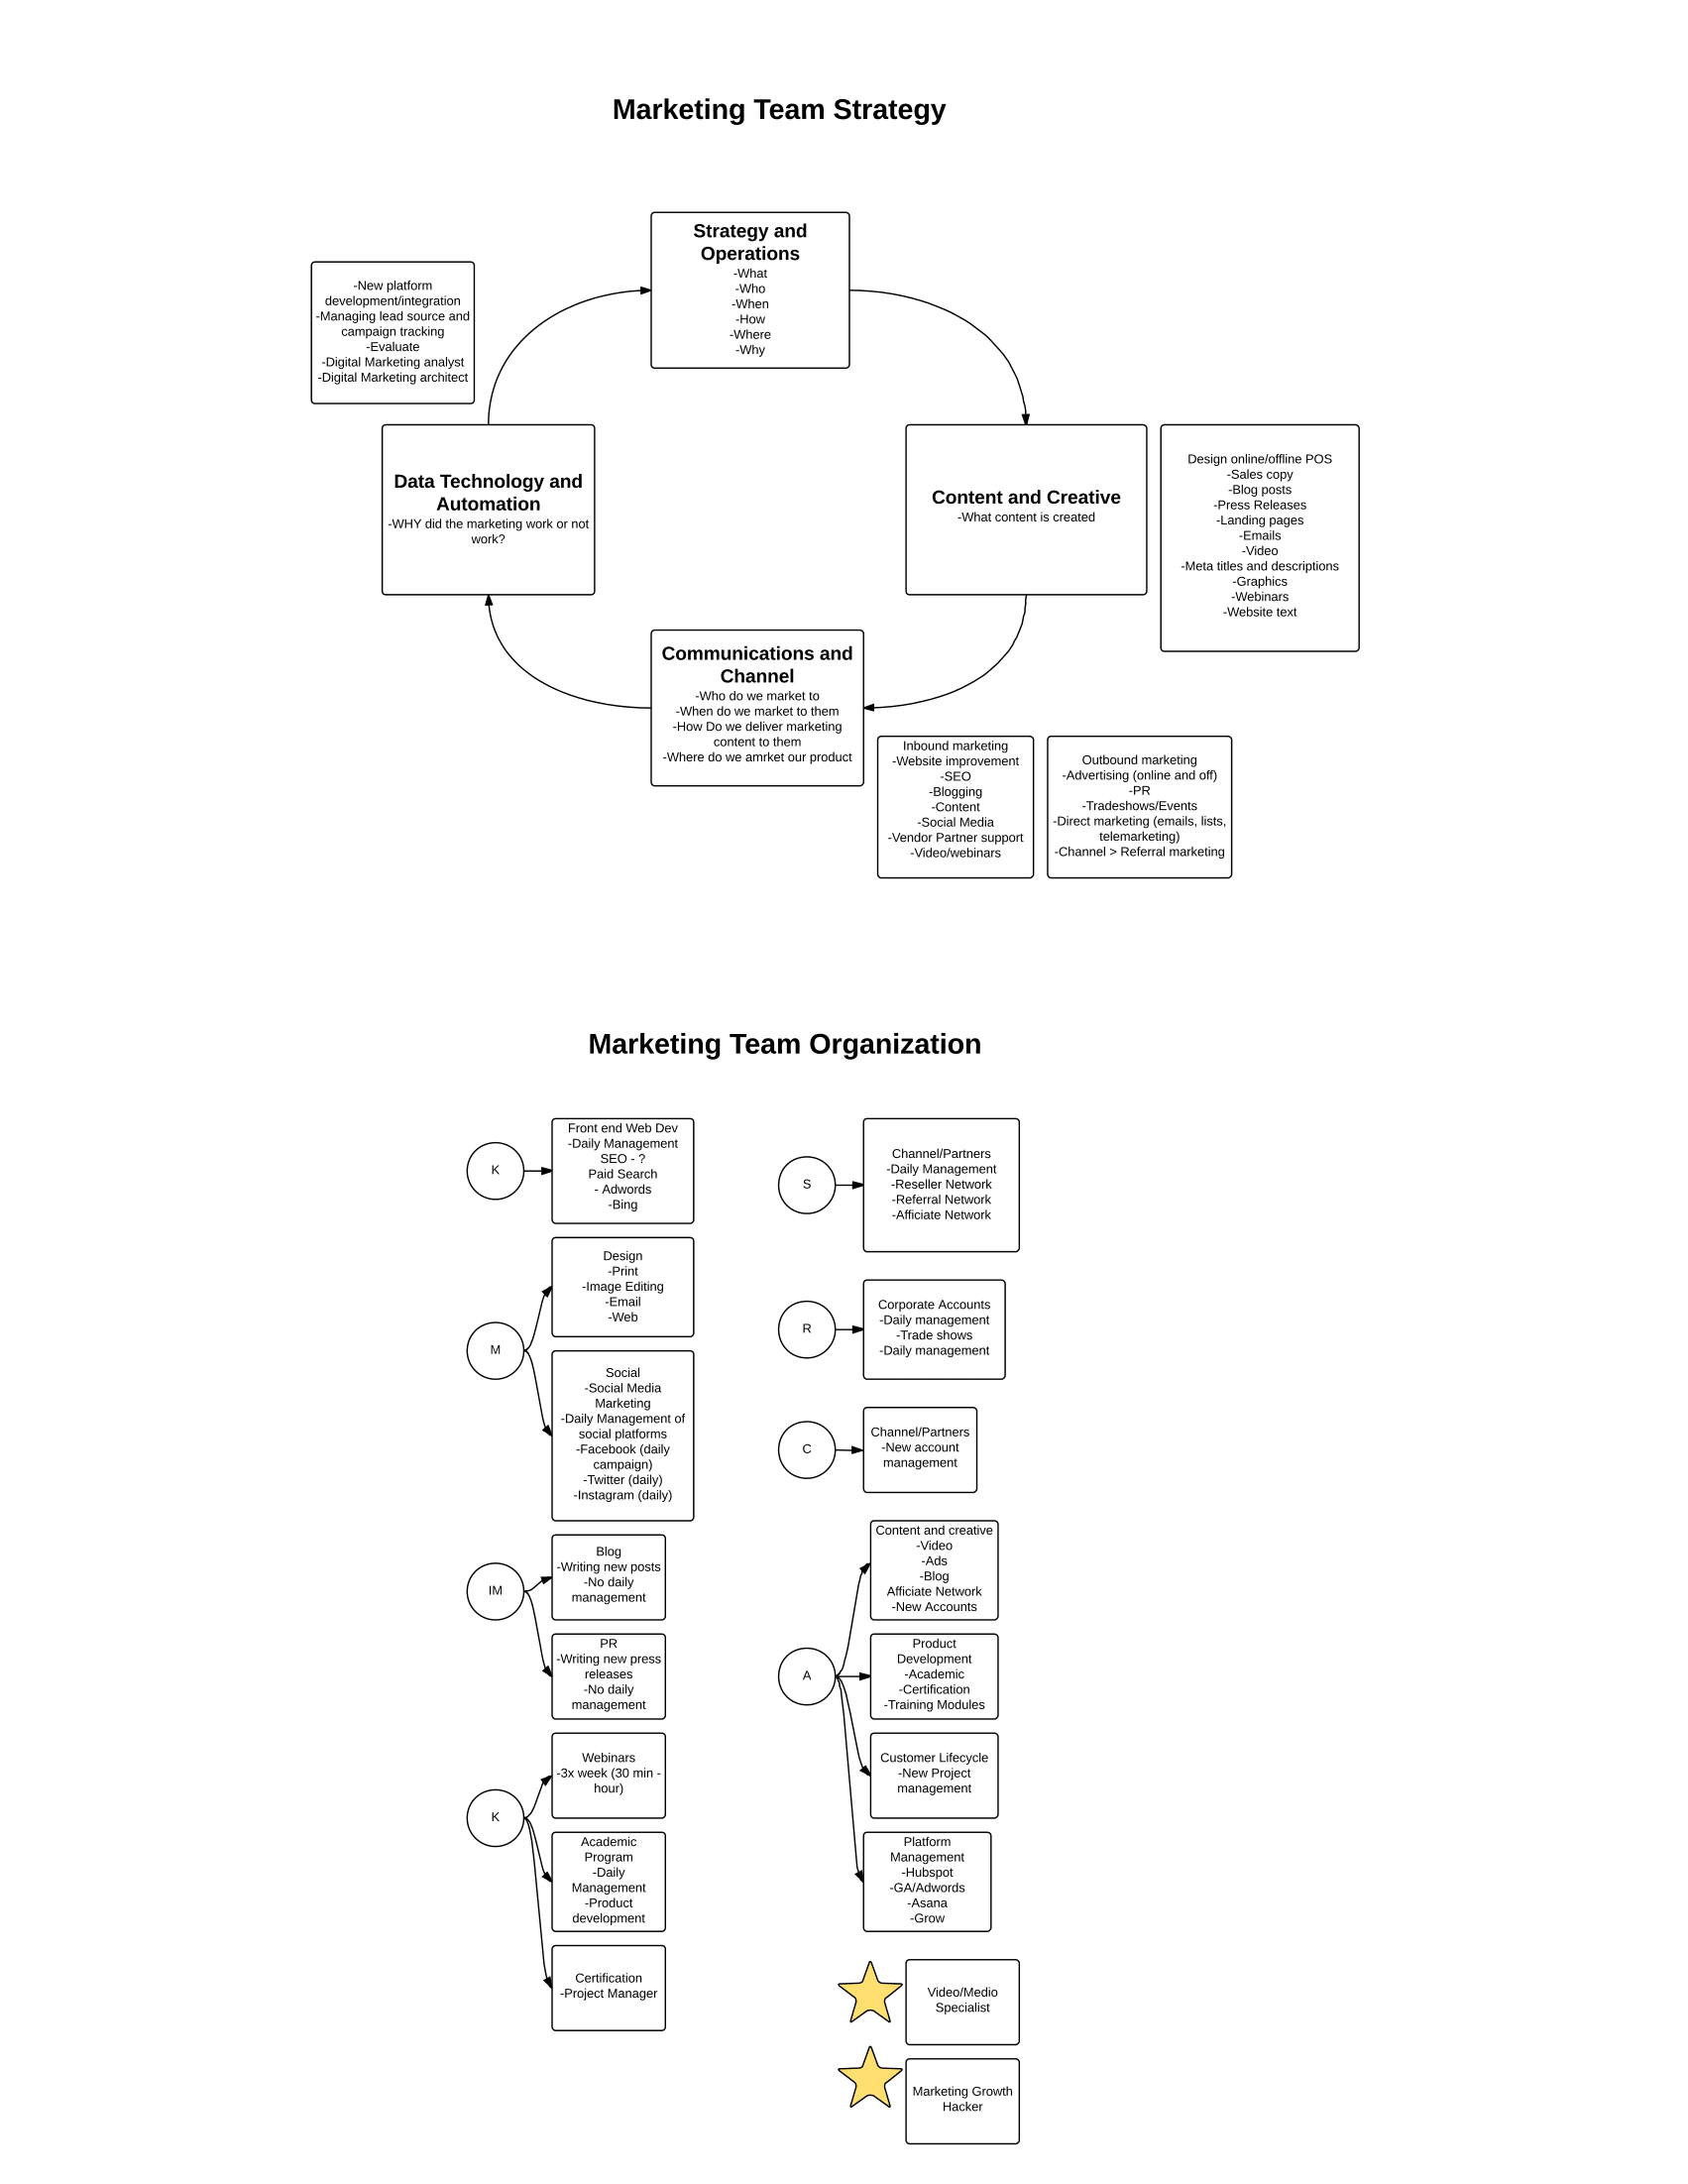
One of the team’s most vital Lucidchart documents maps out the customer lifecycle. This diagram depicts the process a customer takes from downloading the free software to either purchasing the software or no longer qualifying as a lead, and it indicates each department’s role in this process. This lifecycle serves as a constant reference for the entire team and is used to optimize the customer journey in order to convert more free customers to paid.
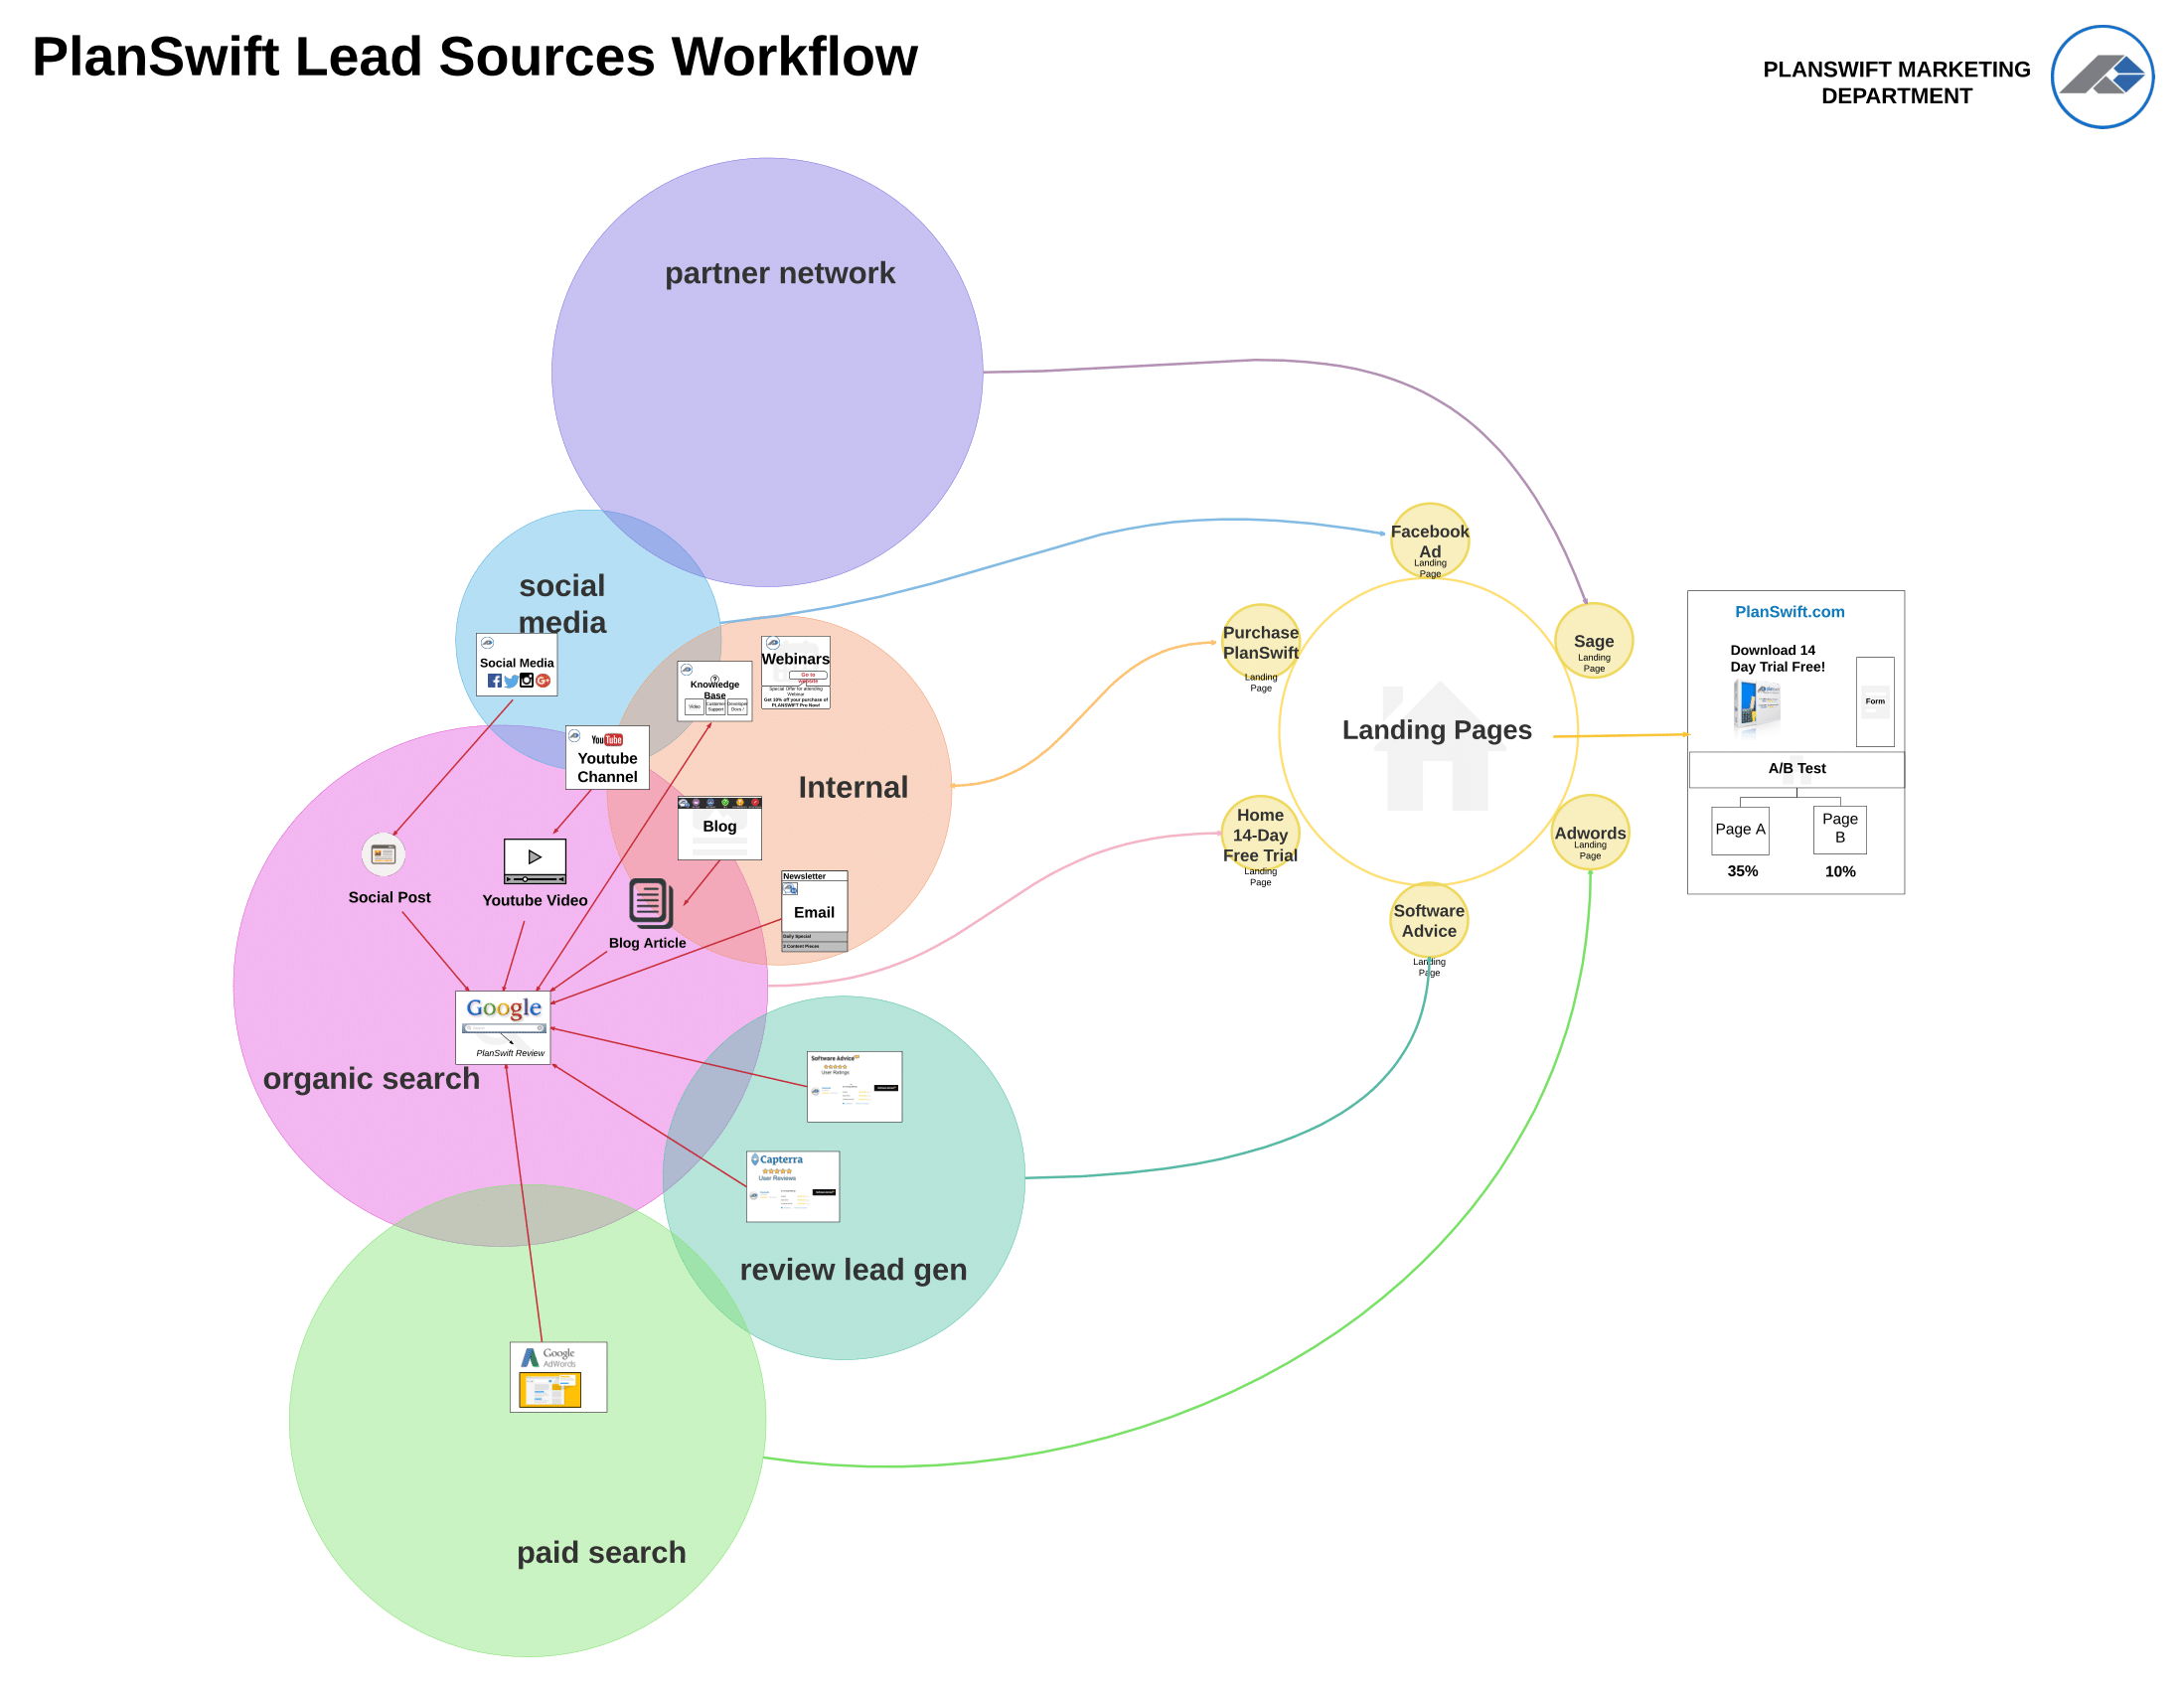
Diving into specific channels
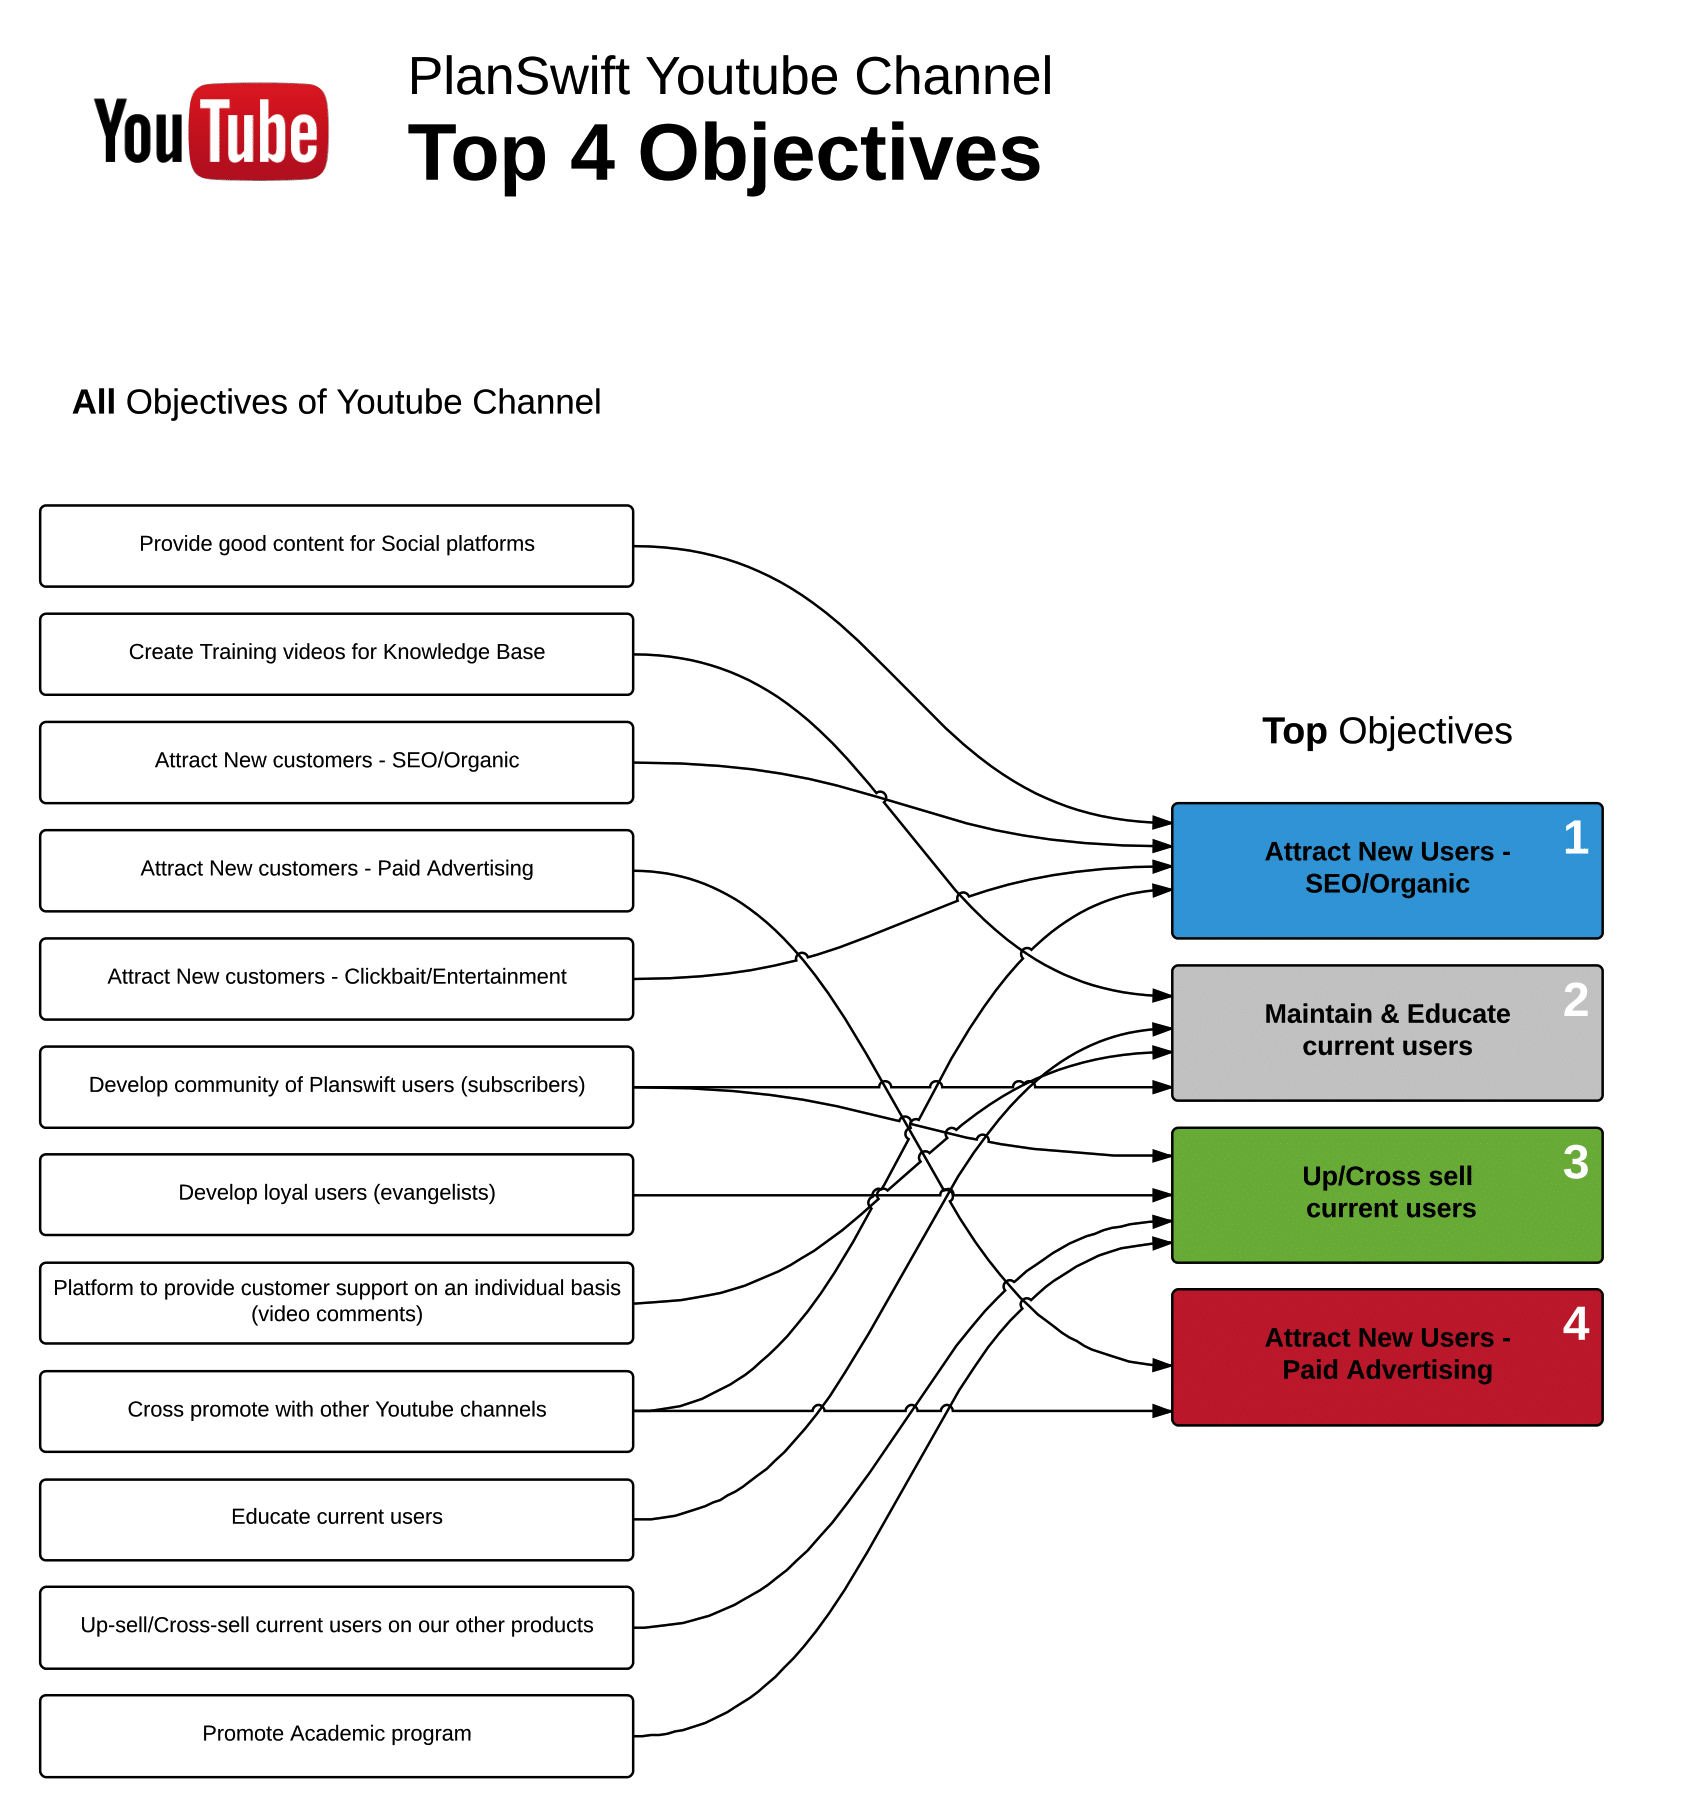
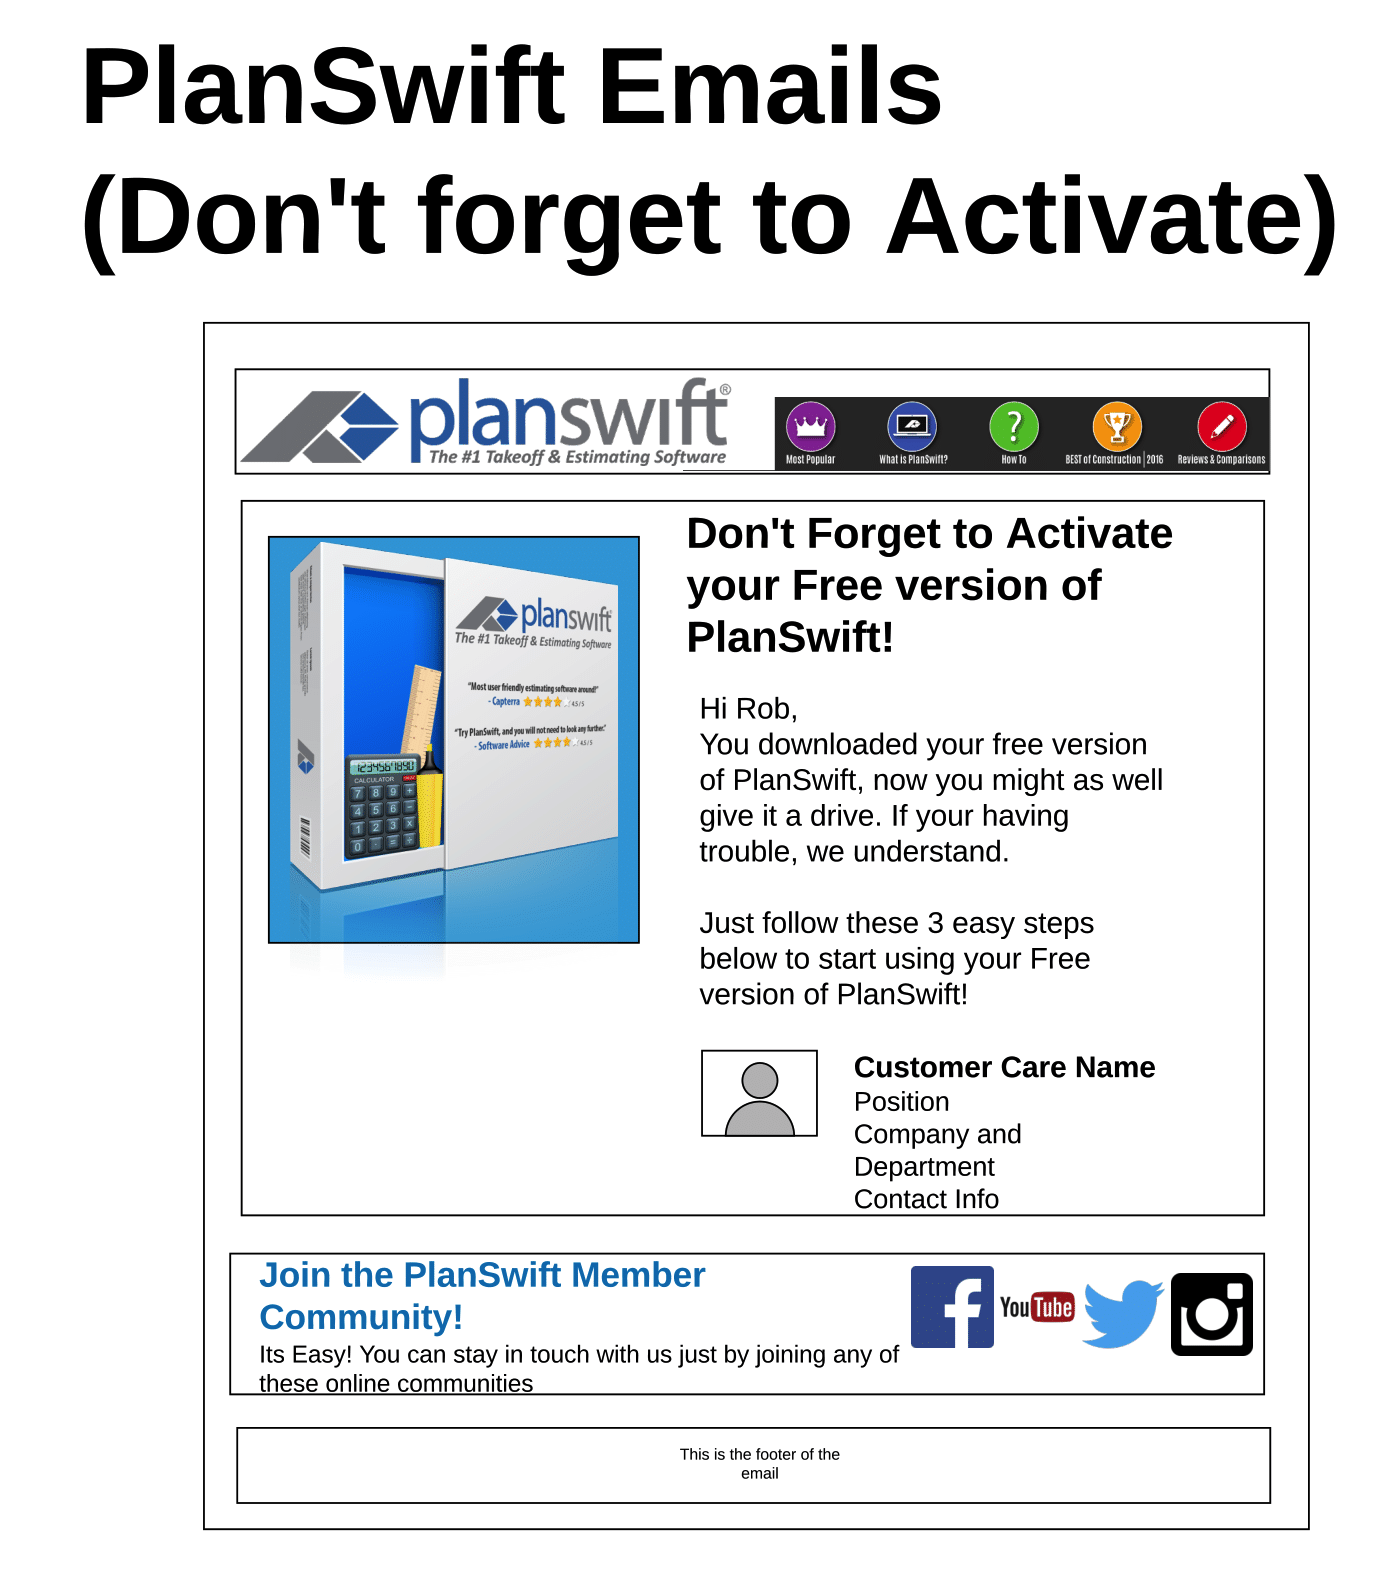
The team can dive deeper into the customer lifecycle by mapping out a specific channel. Lucidchart allows the team to visualize their nurture campaign workflow, a living document outlining the marketing emails a customer receives in the buying process. Employees reference this diagram every time they are working on a new campaign, making it simple to identify which emails are needed in certain situations. PlanSwift also uses Lucidchart to map out the objectives of the company YouTube channel, making them easy to digest and easy to refer back to.
Gaining buy-in
The PlanSwift marketing team has a whole lot of great ideas when it comes to improving this customer lifecycle; however, they often can’t execute without executive buy-in. The team has found Lucidchart to be instrumental in gaining the approval they need to move forward with a project. “When we go into those meetings and we have this idea, we propose it and say, ‘This is what it’s going to look like,’” Jace says. “It helps them visualize things a lot better, which helps with buy-in.”

In addition, presenting their visual in Lucidchart allows for real-time feedback. Instead of having to come together again to hold another meeting, they can respond to feedback by adjusting the visual in real time, allowing everyone to see the changes instantaneously.
Communicating cross-functionally
Once they’ve got the necessary buy-in, marketing often needs assistance from other teams for the execution. They have found Lucidchart to be one of the most effective communication tools in doing so, especially when dealing with remote workers. When working with designers to build the customer emails, the team relies on Lucidchart’s wireframes to mock up exactly how they want the emails to look. This clarity makes design’s job a whole lot easier.
While working on an integration with HubSpot, the marketing team worked hand in hand with the development team. They used Lucidchart to map out how they wanted customers to flow through the lifecycle in HubSpot, mapping out each trigger and its result. An extremely complex process, the visual helped the developers be able to turn the marketing team’s proposal into code.
Driving change
Lucidchart also helps PlanSwift continually improve the processes driving everything they do. “Some things have kind of haphazardly, and the processes are more just band-aids. The business practices are very complicated. We use Lucidchart to try and understand them, explain how they work and relate, and convey why we do these things. Then we can try and simplify and refine these processes,” Jace says.
Building these diagrams gets everyone on the same page in understanding the different processes, allowing them to work on identifying where they can be fixed. “Creating these visuals has driven people toward change—it’s very hard to make people change business practices. But it’s made people aware that change is needed,” Jace concludes.
Why Lucidchart
“A picture is worth a thousand words. You can sit here and explain all you want, but if you just have them look at the visual, they can understand everything without you going on for hours about it,” describes Ida Barlow, marketing consultant at PlanSwift.
Jace jumps in. “In addition to that, these diagrams are something for people to refer back to if they don’t understand. They know that they can go back to look at it and remember something that was said in a meeting instead of just reading a big giant paragraph of text. That happens frequently, where we’ll see a big block of text and be like, ‘We really need to map this out a different way.’ Then try to visualize it a lot better.”
And Lucidchart makes it simple for the team to make these visuals. “Lucidchart is so easy. When I first started using it, I didn’t need to sit down and learn how to use it or go through a training. It was all very easy to pick up.” The team loves that they can pull from all the different shape libraries to quickly represent their ideas.
And PlanSwift is reaping the rewards of visual thinking. “Lucidchart saves us hundreds of hours per year in communication and planning,” says Jace. “And I’m sure Aaron would say it’s in the tens of thousands.”
The whole PlanSwift team has clearly caught Aaron’s vision—they are all firm believers in the power of visuals.
See the original article here: